
In the last essay, we described the modern AI SRE as a verbalization layer on top of the operational data, focusing on the architecture. Now, we’re going to see if that’s really the case by looking at the evidence that the vendors presented.
Think about what a product’s front page actually is. Marketing picks the scenario. Engineering stages or selects the data. Design composes the frame. Someone in leadership signs off on the claim the frame is meant to carry. So the image you end up looking at isn’t necessarily the technical ceiling of the product. It’s the persuasive ceiling: the single scene the vendor decided would best explain what the thing is and why you should want it.
That turns out to be a gift for anyone reading closely. We don’t have to invent a hostile test or build our own benchmark. We can just look at the product under the conditions its own maker thought were most flattering.
What follows is a critique of two AI SRE product showcases. Datadog’s Bits AI pages showcase three screens: two autonomous investigations triggered by monitor alerts and a chat assistant positioned next to a service dashboard. Dash0’s Agent0 presents two, but with a more stripped-down architecture. These two products represent opposite ends of the presentation spectrum, from ornate to bare, yet they display the same emptiness in understanding.
DataDog Bits AI
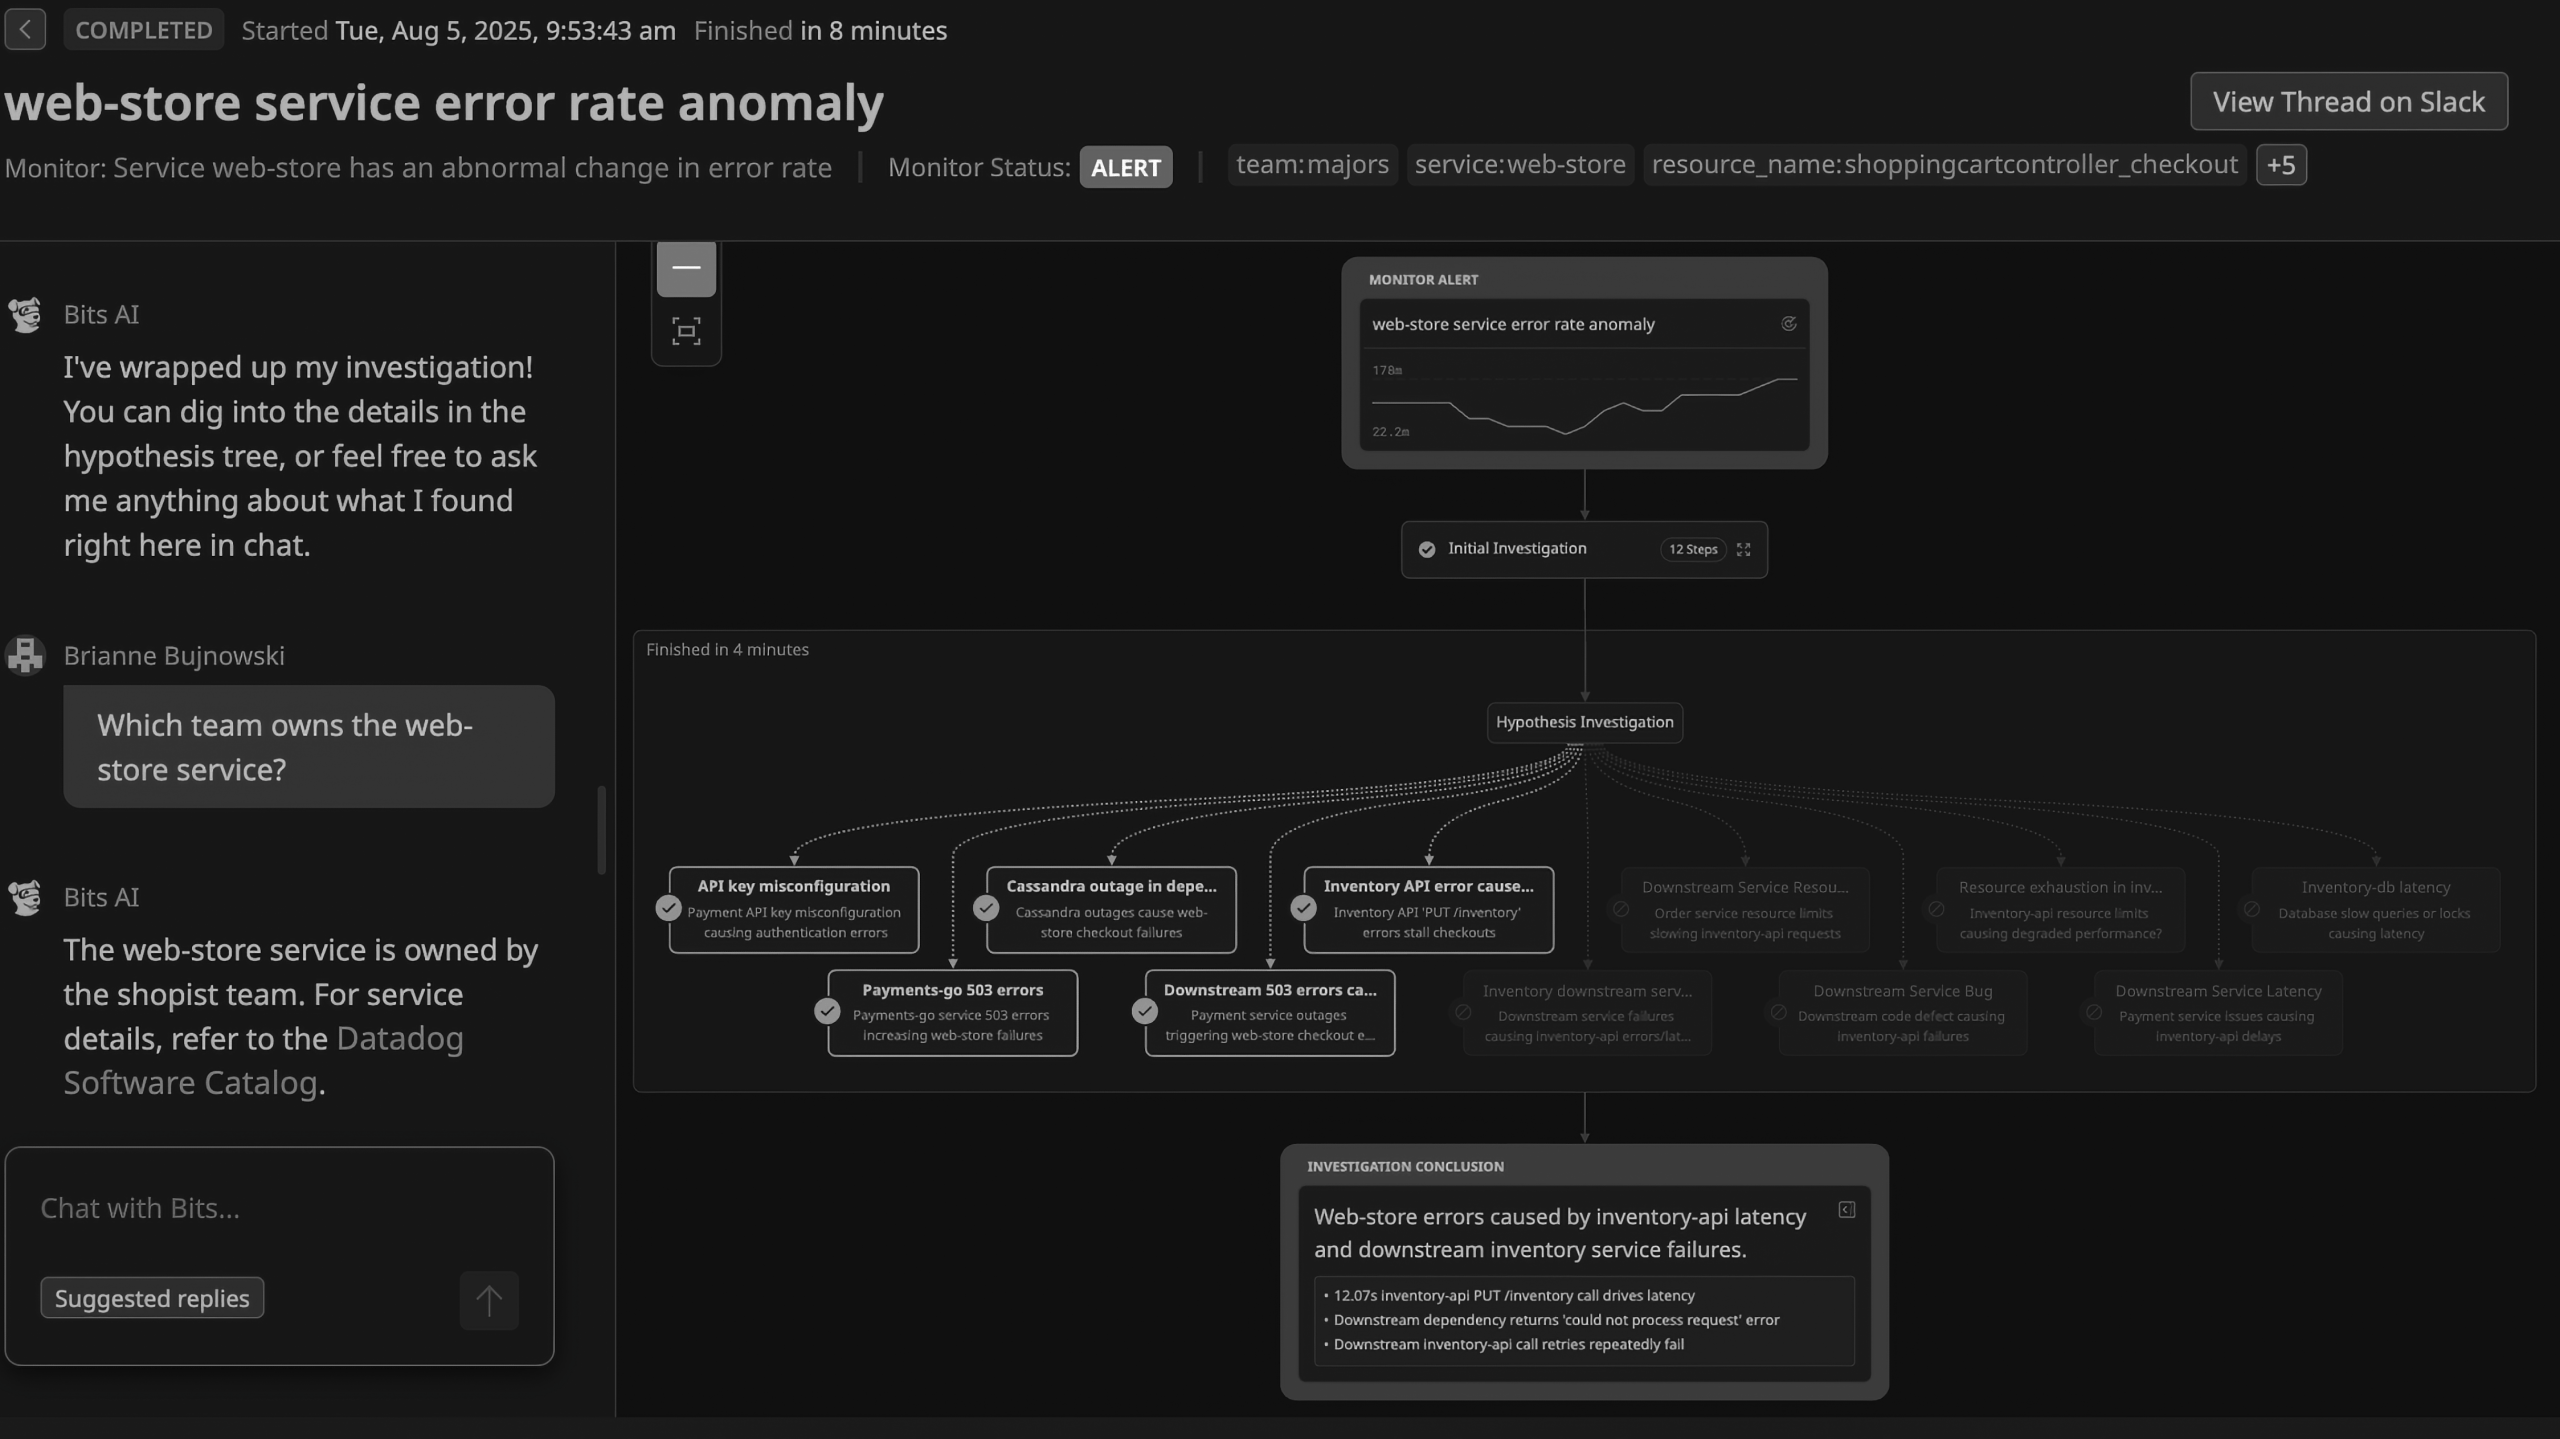
Start with the header, because it quietly settles the most important question. Status: COMPLETED. Started Tuesday at 9:53:43 am. Finished in 8 minutes. The whole investigation happens after the monitor fires, and wraps up eight minutes later. While those minutes tick by, the checkout path keeps failing and the retries keep hammering the inventory API.
Now look at the dialogue they put front and center, because it’s worth quoting in full. A human asks: “Which team owns the web-store service?” The agent answers: the shopist team, and here’s the Software Catalog. Out of every possible exchange they could have staged for the front page, this is the one they judged most compelling. The hero moment for agentic AI is looking up a metadata field. That tells you where the persuasive ceiling sits.
The hypothesis tree, situated in the center of the screen, comprises twelve branches emanating from the investigation node. Each branch represents a potential explanation, accompanied by a query. Scientifically, a hypothesis is an educated guess about a mechanism—a narrative outlining how one phenomenon could give rise to another. It’s precisely formulated to facilitate its testing and potential refutation. However, the tree depicted on the screen is narrower in scope. It doesn’t serve as a model of the operating system itself. Instead, it represents a model of the searchable evidence that exists in the system. What is depicted is the structure of datasources and the stored record types.
At the bottom, the conclusion states: “Web-store errors are caused by inventory-api latency and downstream inventory service failures.” Three bullets back, it provides observations to support this conclusion. These observations include latency, errors, retries, and dependency edges, which are all recorded data points. The phrase “caused by” transforms these observations into an explanation, and the interface makes this transition appear almost effortlessly empty. It is.
The conclusion might be right. But notice what the screen doesn’t show: any system model that could tell a causal mechanism apart from evidence that merely happens to line up in time. What it shows is a successful navigation path through the records, and a sentence that presents a path as cause. It’s saving clicks. There’s no situational intelligence.
The sign-off rounds it all up: “I’ve wrapped up my investigation! You can explore the details in the hypothesis tree, or feel free to ask me anything…” The exclamation point exudes pure cheerfulness. And the sentence accurately describes the entire product’s functionality. DataDog’s AI Bits is a polished marketing mirage on top of a browsable rendering of the evidence it collected, accompanied by a chat box on top of the retrieved information.
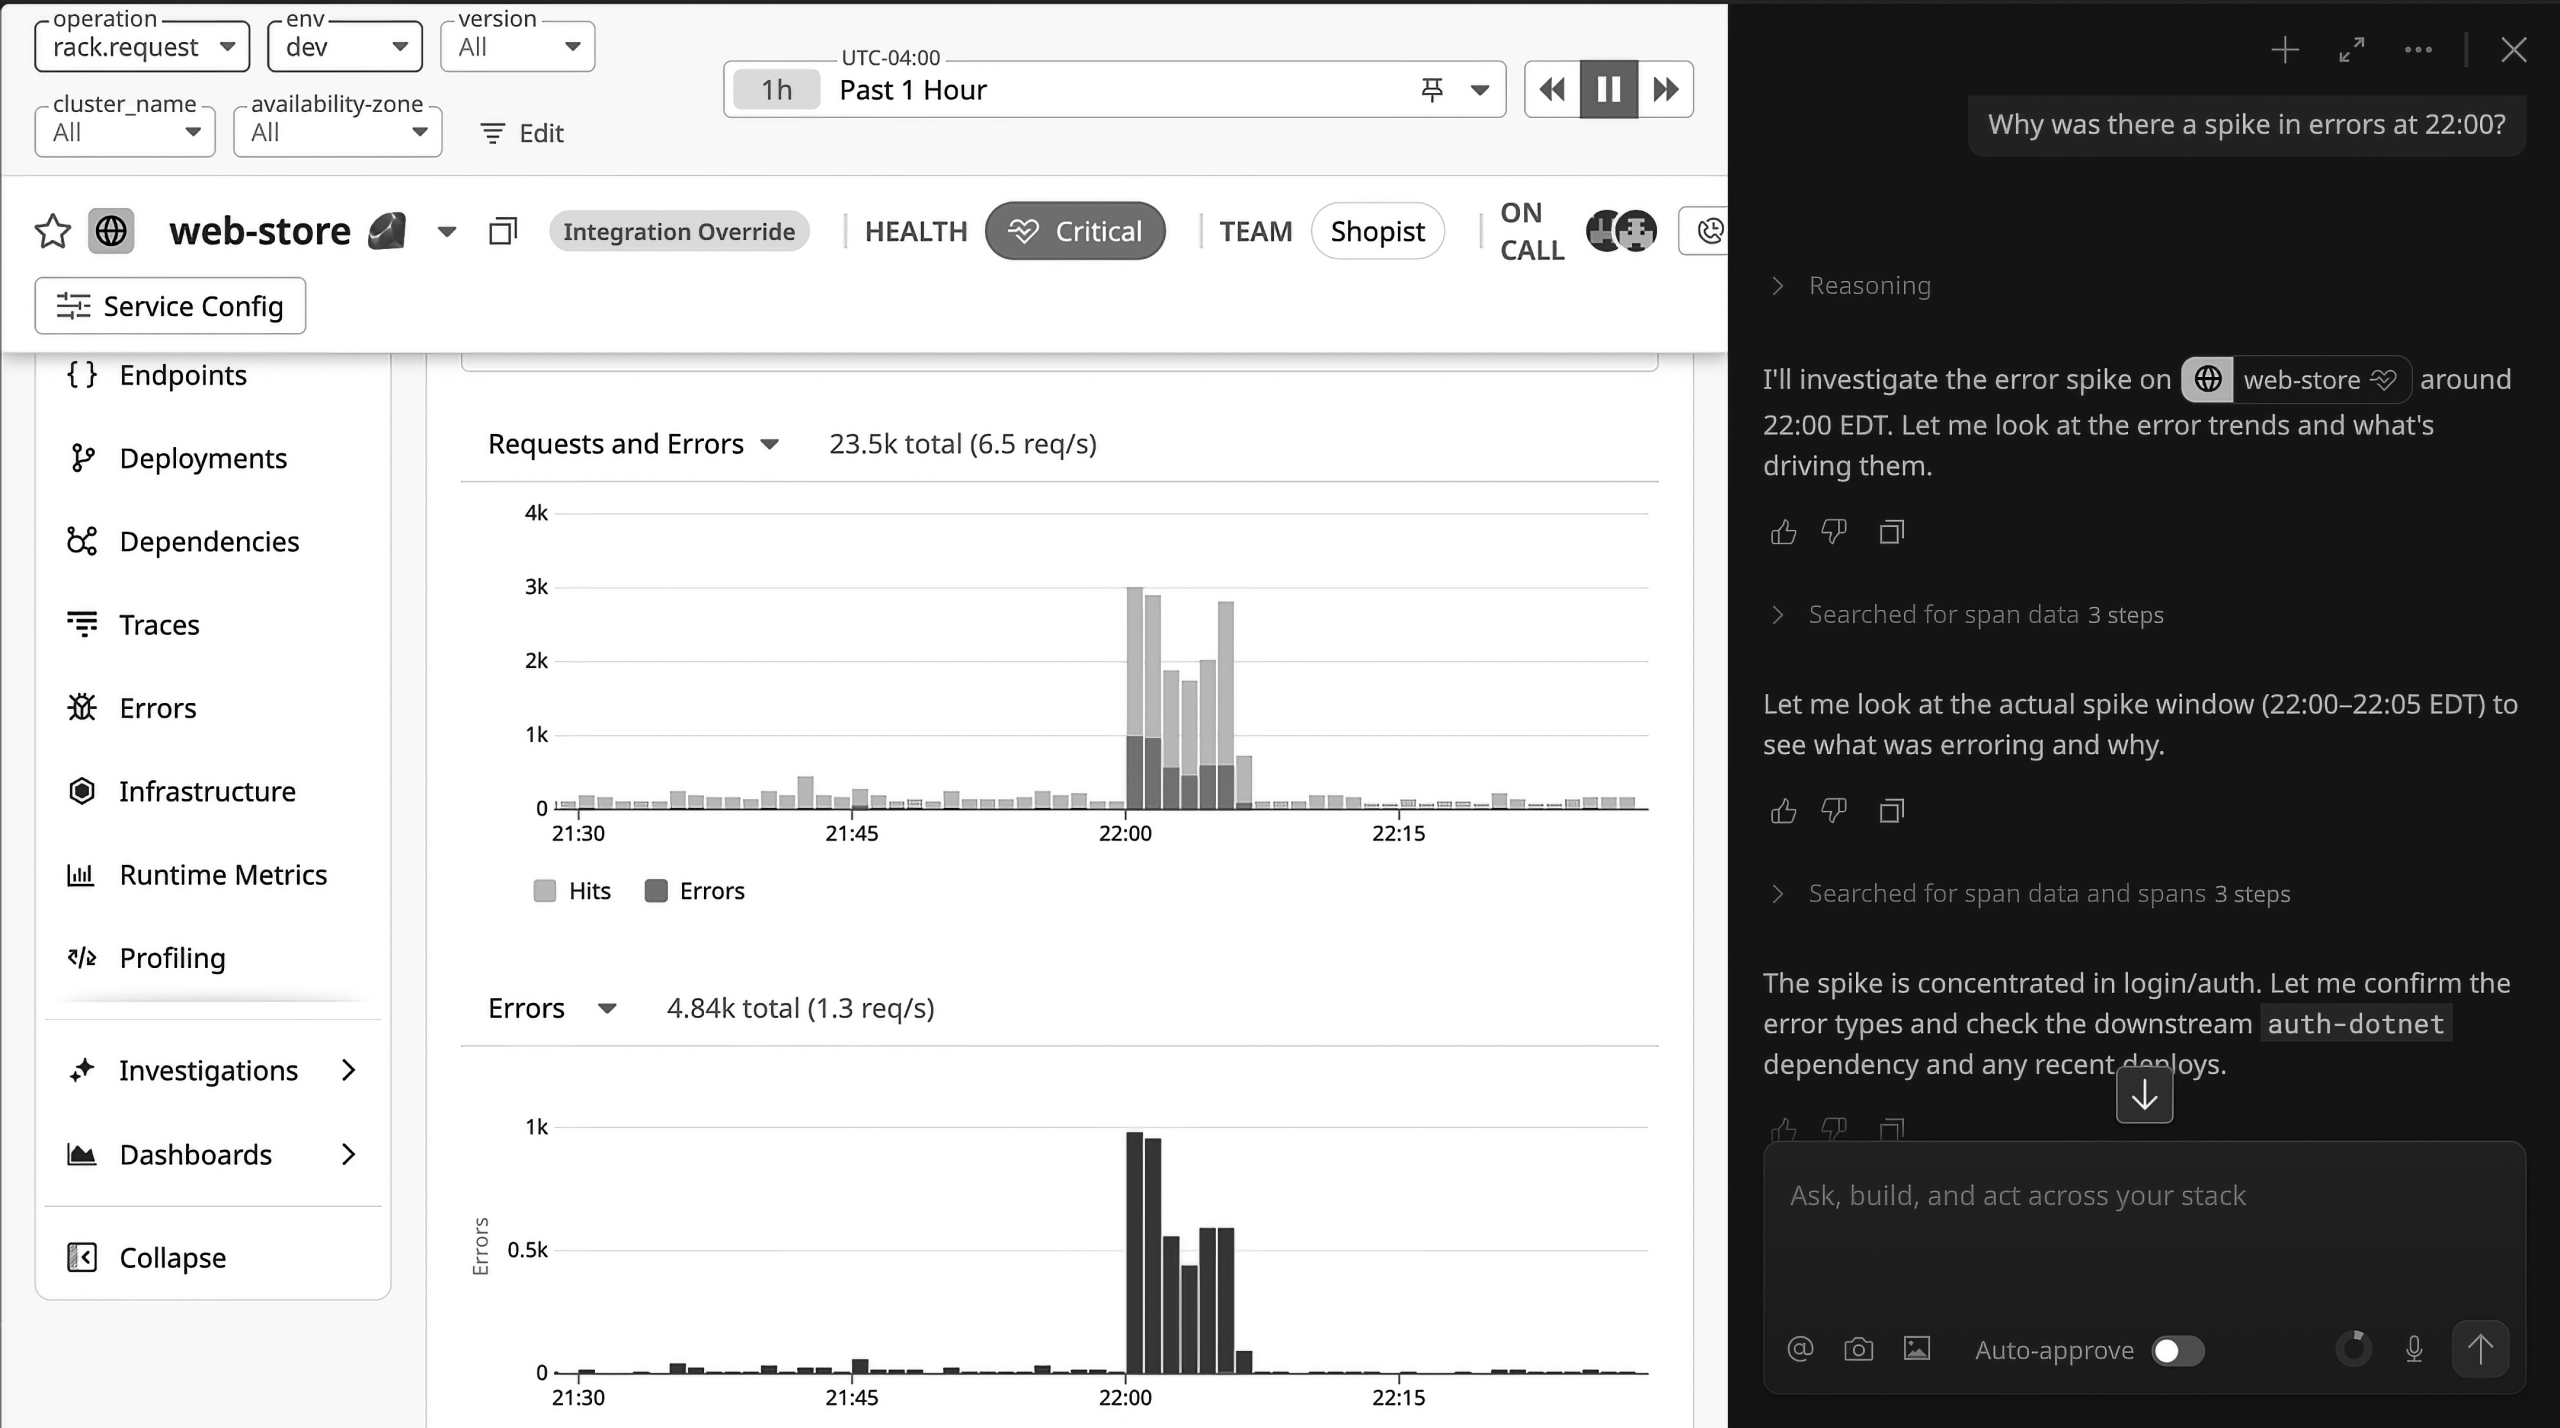
This one says so much through layout alone. The left side is the telemetry: request and error charts for the web-store service, the spike at 22:00 plain to see, red bars bunched in a five-minute window. The right side is a chat panel turning the left side into sentences. And in between sits the human, whose eyes carry the information across.
Here a language surface is bolted next to a pile of records, with human attention acting as the wire between them.
The exchange opens with the user’s question: “Why was there a spike in errors at 22:00?” Someone spotted it, at 22:00, and made a judgment that something was wrong. The human did all the perceiving and handed over a fully formed situation. The agent’s job only begins once every interesting decision has already been made.
The “Reasoning” disclosure then shows you what that job consists of. “I’ll investigate the error spike on web-store around 22:00 EDT. Let me look at the error trends”. This is a query. “Searched for span data, 3 steps”. Now three queries. “Let me look at the actual spike window (22:00–22:05 EDT)”. A filtered query. “The spike is concentrated in login/auth. Let me confirm the error types and check the downstream auth-dotnet dependency and any recent deploys”. More queries, each one narrowed by the last. The first-person voice dresses query execution up as deliberation.
The path it follows is instantly recognizable to any SRE: spike window, error types, downstream dependency, and recent deploys. This is the standard runbook, the click-path through a telemetry console during an incident. The product automates the clicking while preserving the clicking’s epistemology. It’s a mouse, transcribed into prose.
Two small bits of furniture finish the picture. Under each reasoning step sit thumbs-up and thumbs-down buttons. A sort of feedback dropped into an incident workflow, so the engineer debugging production is labeling training data at the same time. And at the bottom of the panel there’s a toggle marked “Auto-approve,” switched off. That toggle quietly states the trust model: the agent’s actions are interventions picked from an external control surface and held behind a human gate, not regulation coming from a model that lives inside the system.
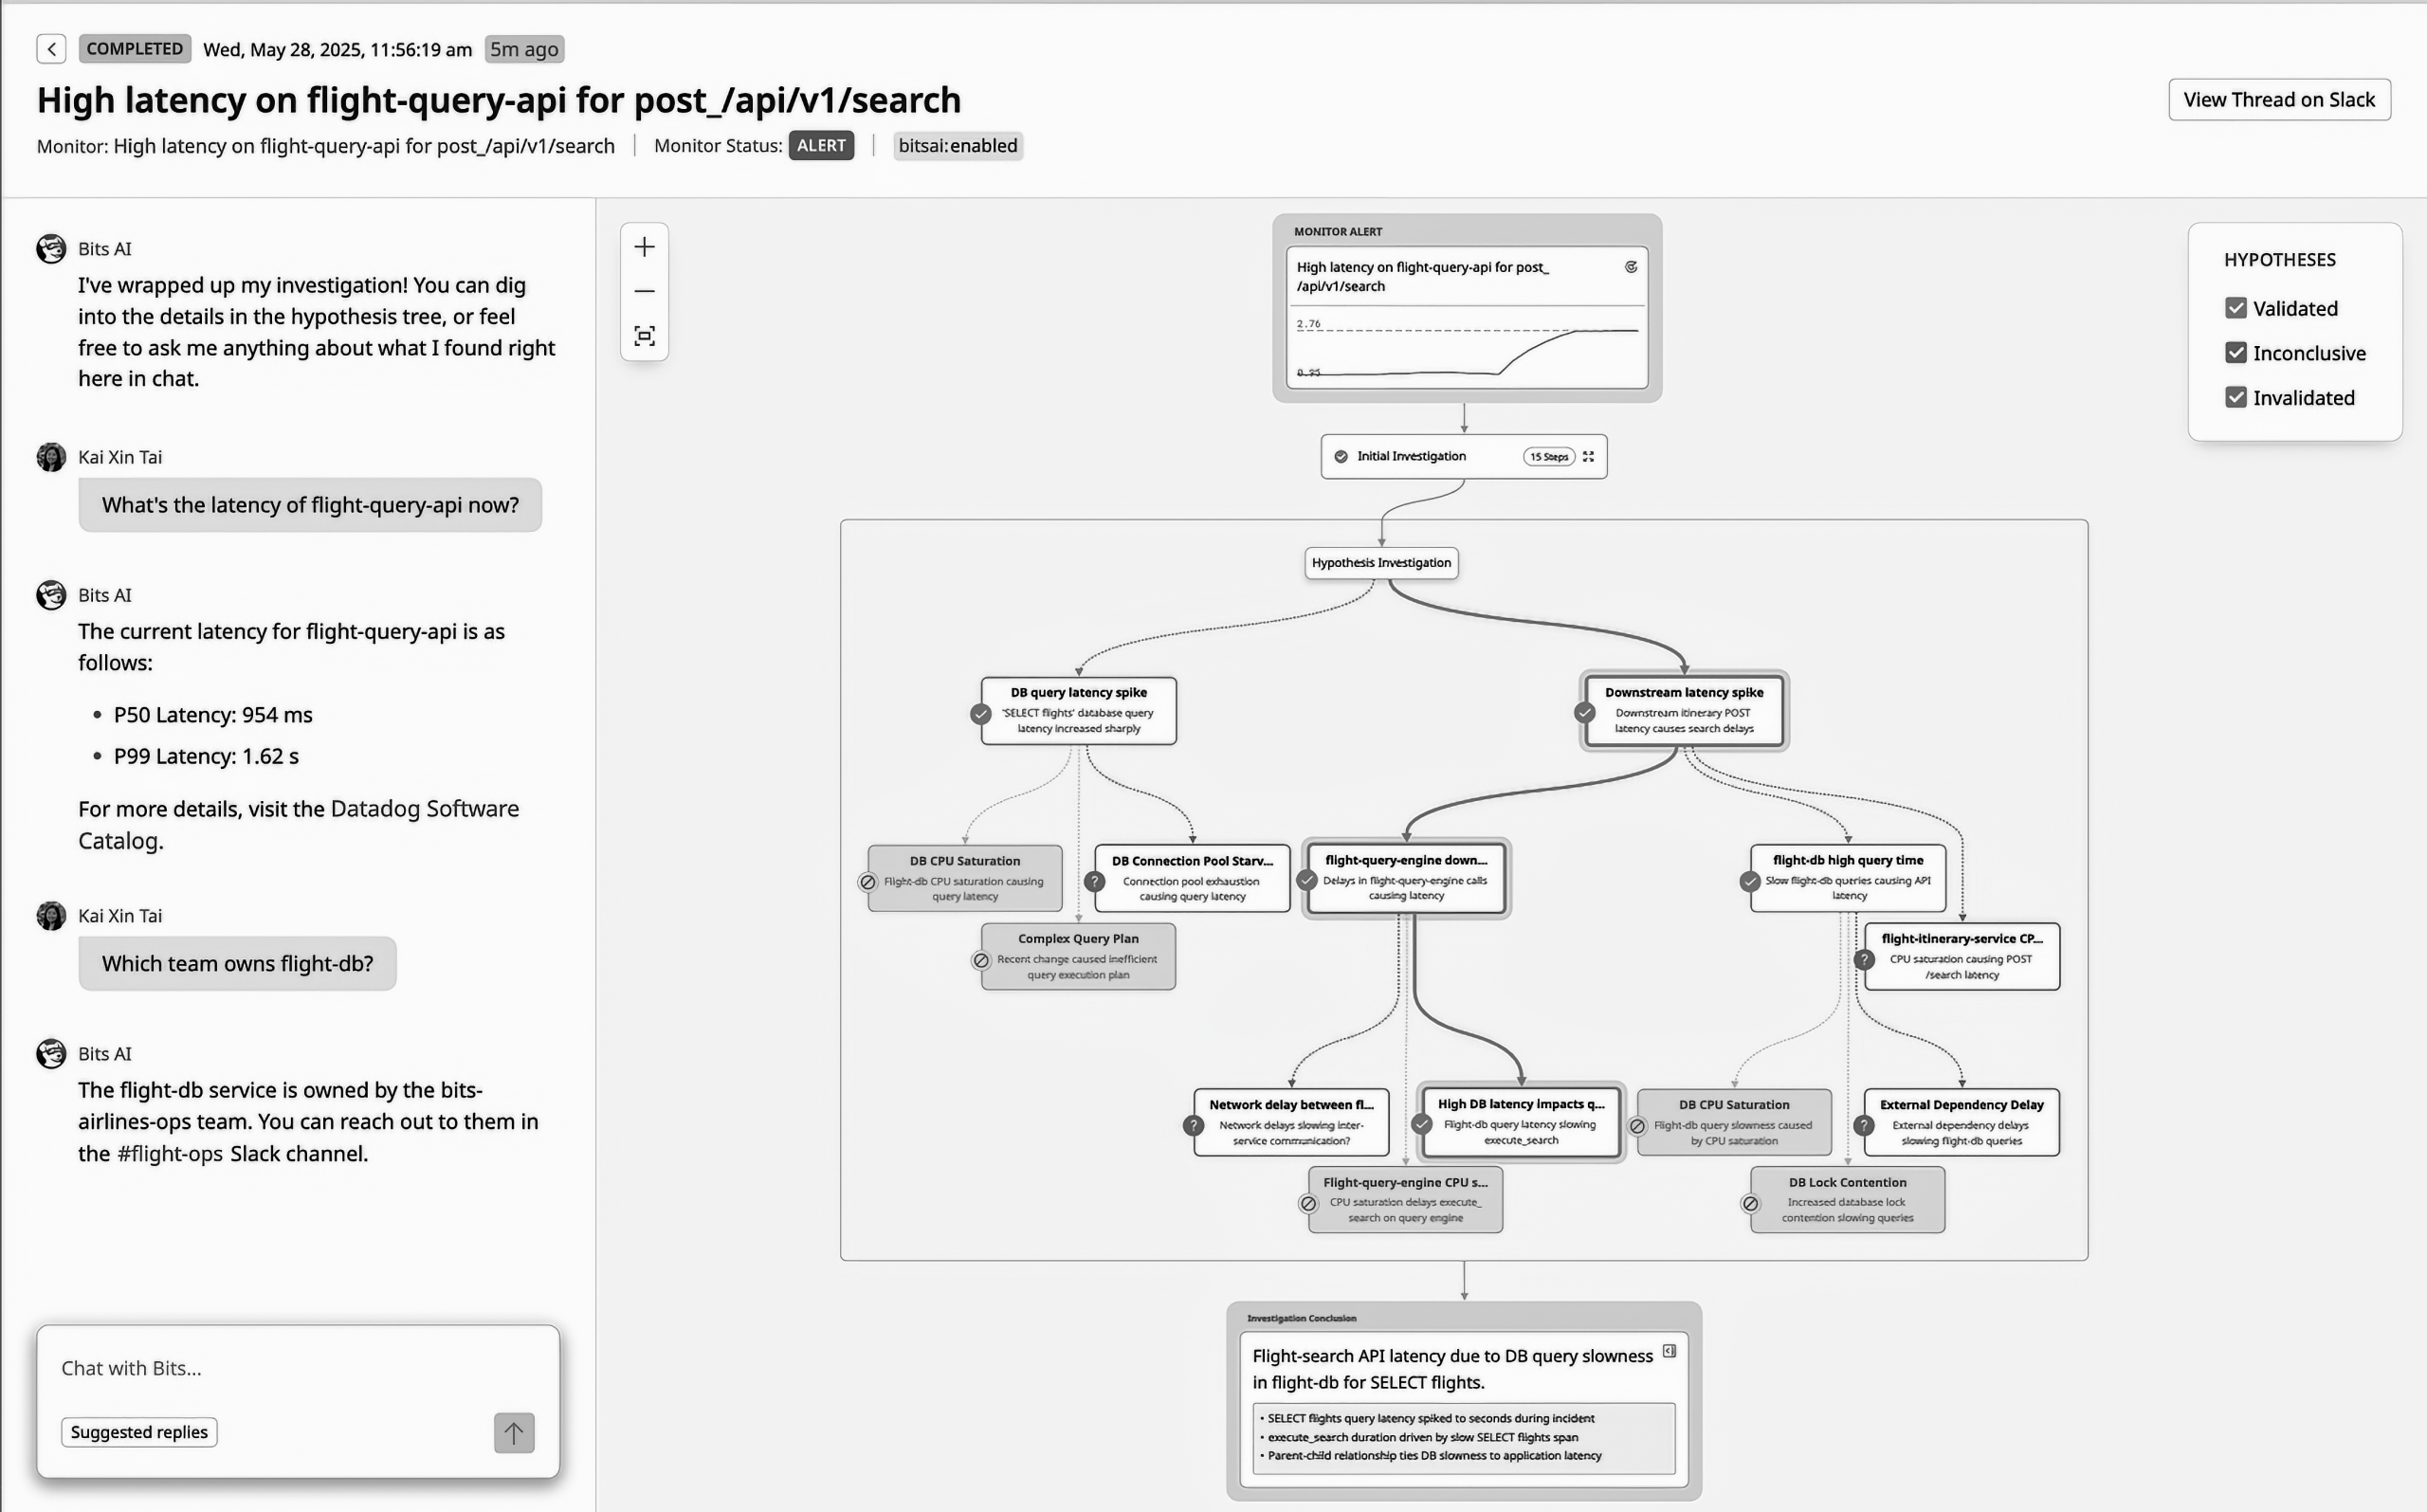
The third screen is a different service, a different symptom, a different conclusion. The grammar is identical.
A monitor alert comes in at the top. An initial investigation follows. A hypothesis tree opens up underneath . Off in the corner, a legend names the scoring scheme out loud: Validated, Inconclusive, Invalidated. At the bottom the tree collapses into a prose conclusion. And alongside it, the same chat pattern as before where a human asks for the current latency and who owns the service, the agent answers by retrieval.
The repetition is the whole point. Two unrelated incidents, and the shape holds exactly: something significant comes in, candidate explanations branch out beneath it, targeted queries pull back evidence, the evidence gets scored, the promising branches grow, the rest get pruned, and the survivor is summarized into a causal sentence. Enumerate, query, classify, descend, summarize. This isn’t a picture of one investigation. It’s the product’s simplistic way of working.
Dash0 Agent0
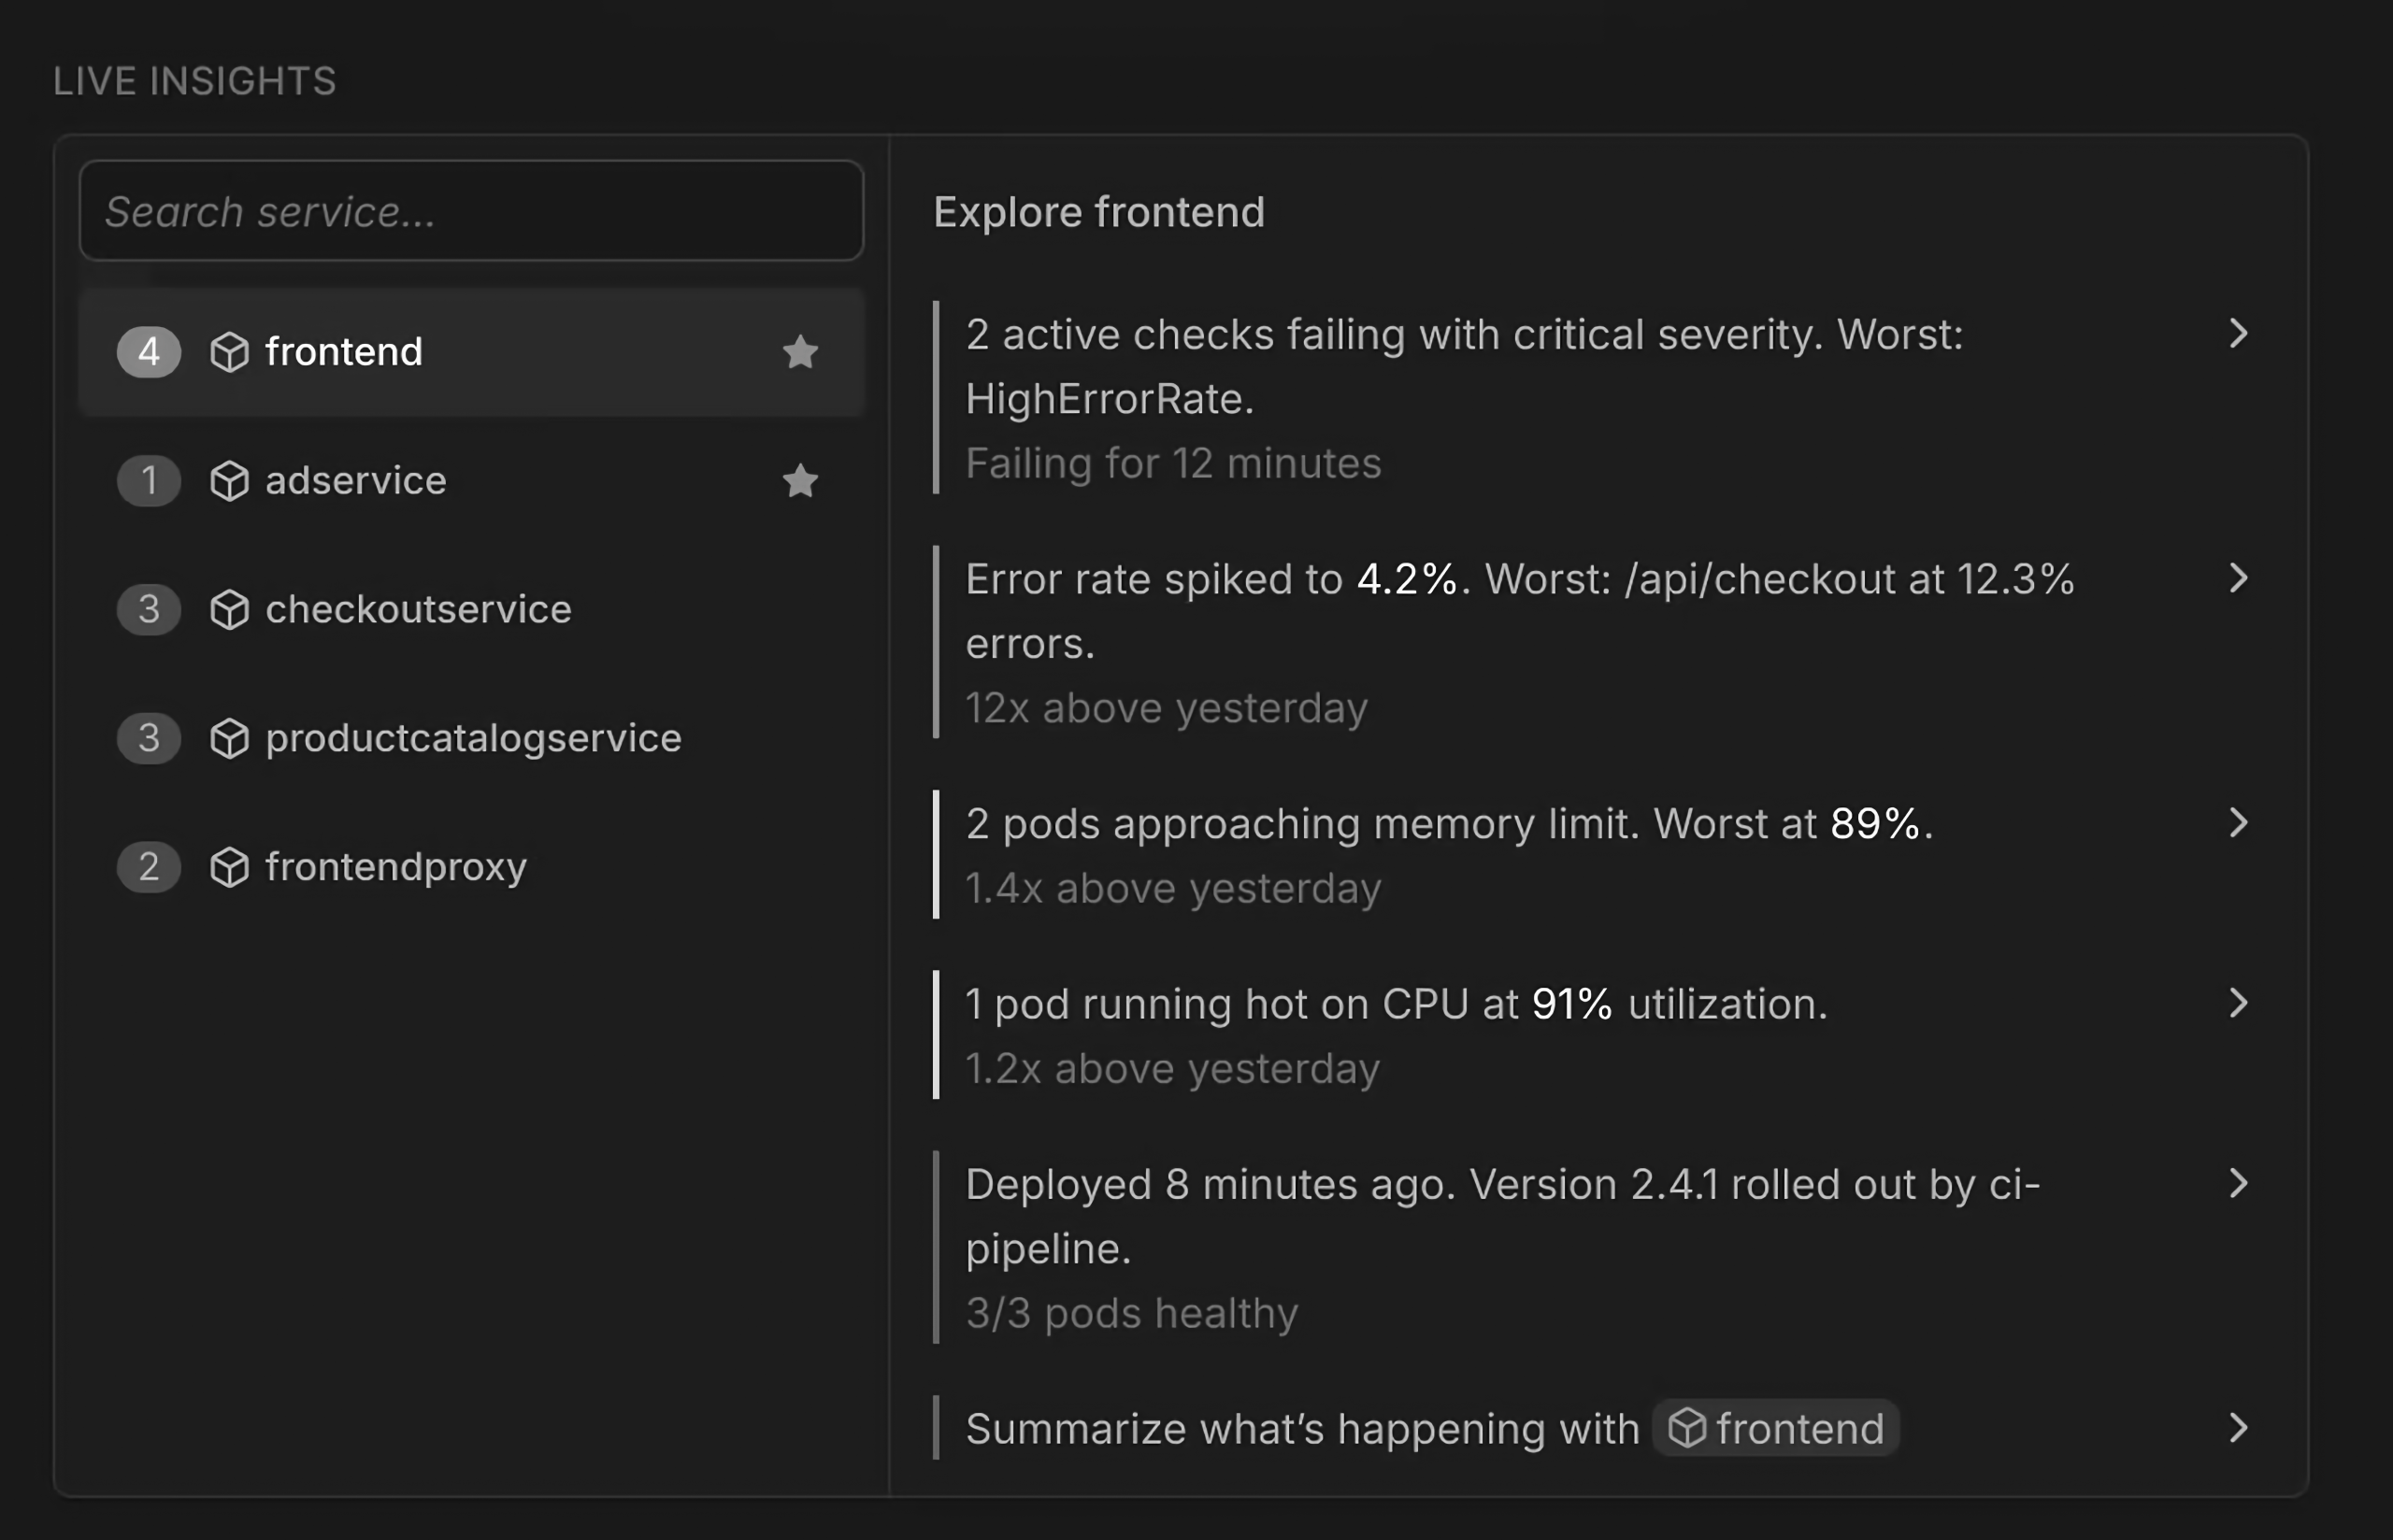
The Dash0 “Live Insights” panel just lists the state of a service in short declarative sentences. Every line has the same guts. A query runs over the records. A comparator checks the result against a threshold, a configured limit, or yesterday’s baseline. A template turns the comparison into a sentence, and a colored bar carries whatever severity tier the comparator already assigned. This is a rule engine’s output, written as prose. The conditions it’s surfacing are the conditions threshold evaluation has been surfacing for decades. The panel’s final offer is to take the list of computed conditions above it and turn it into a paragraph. A summary of summaries.
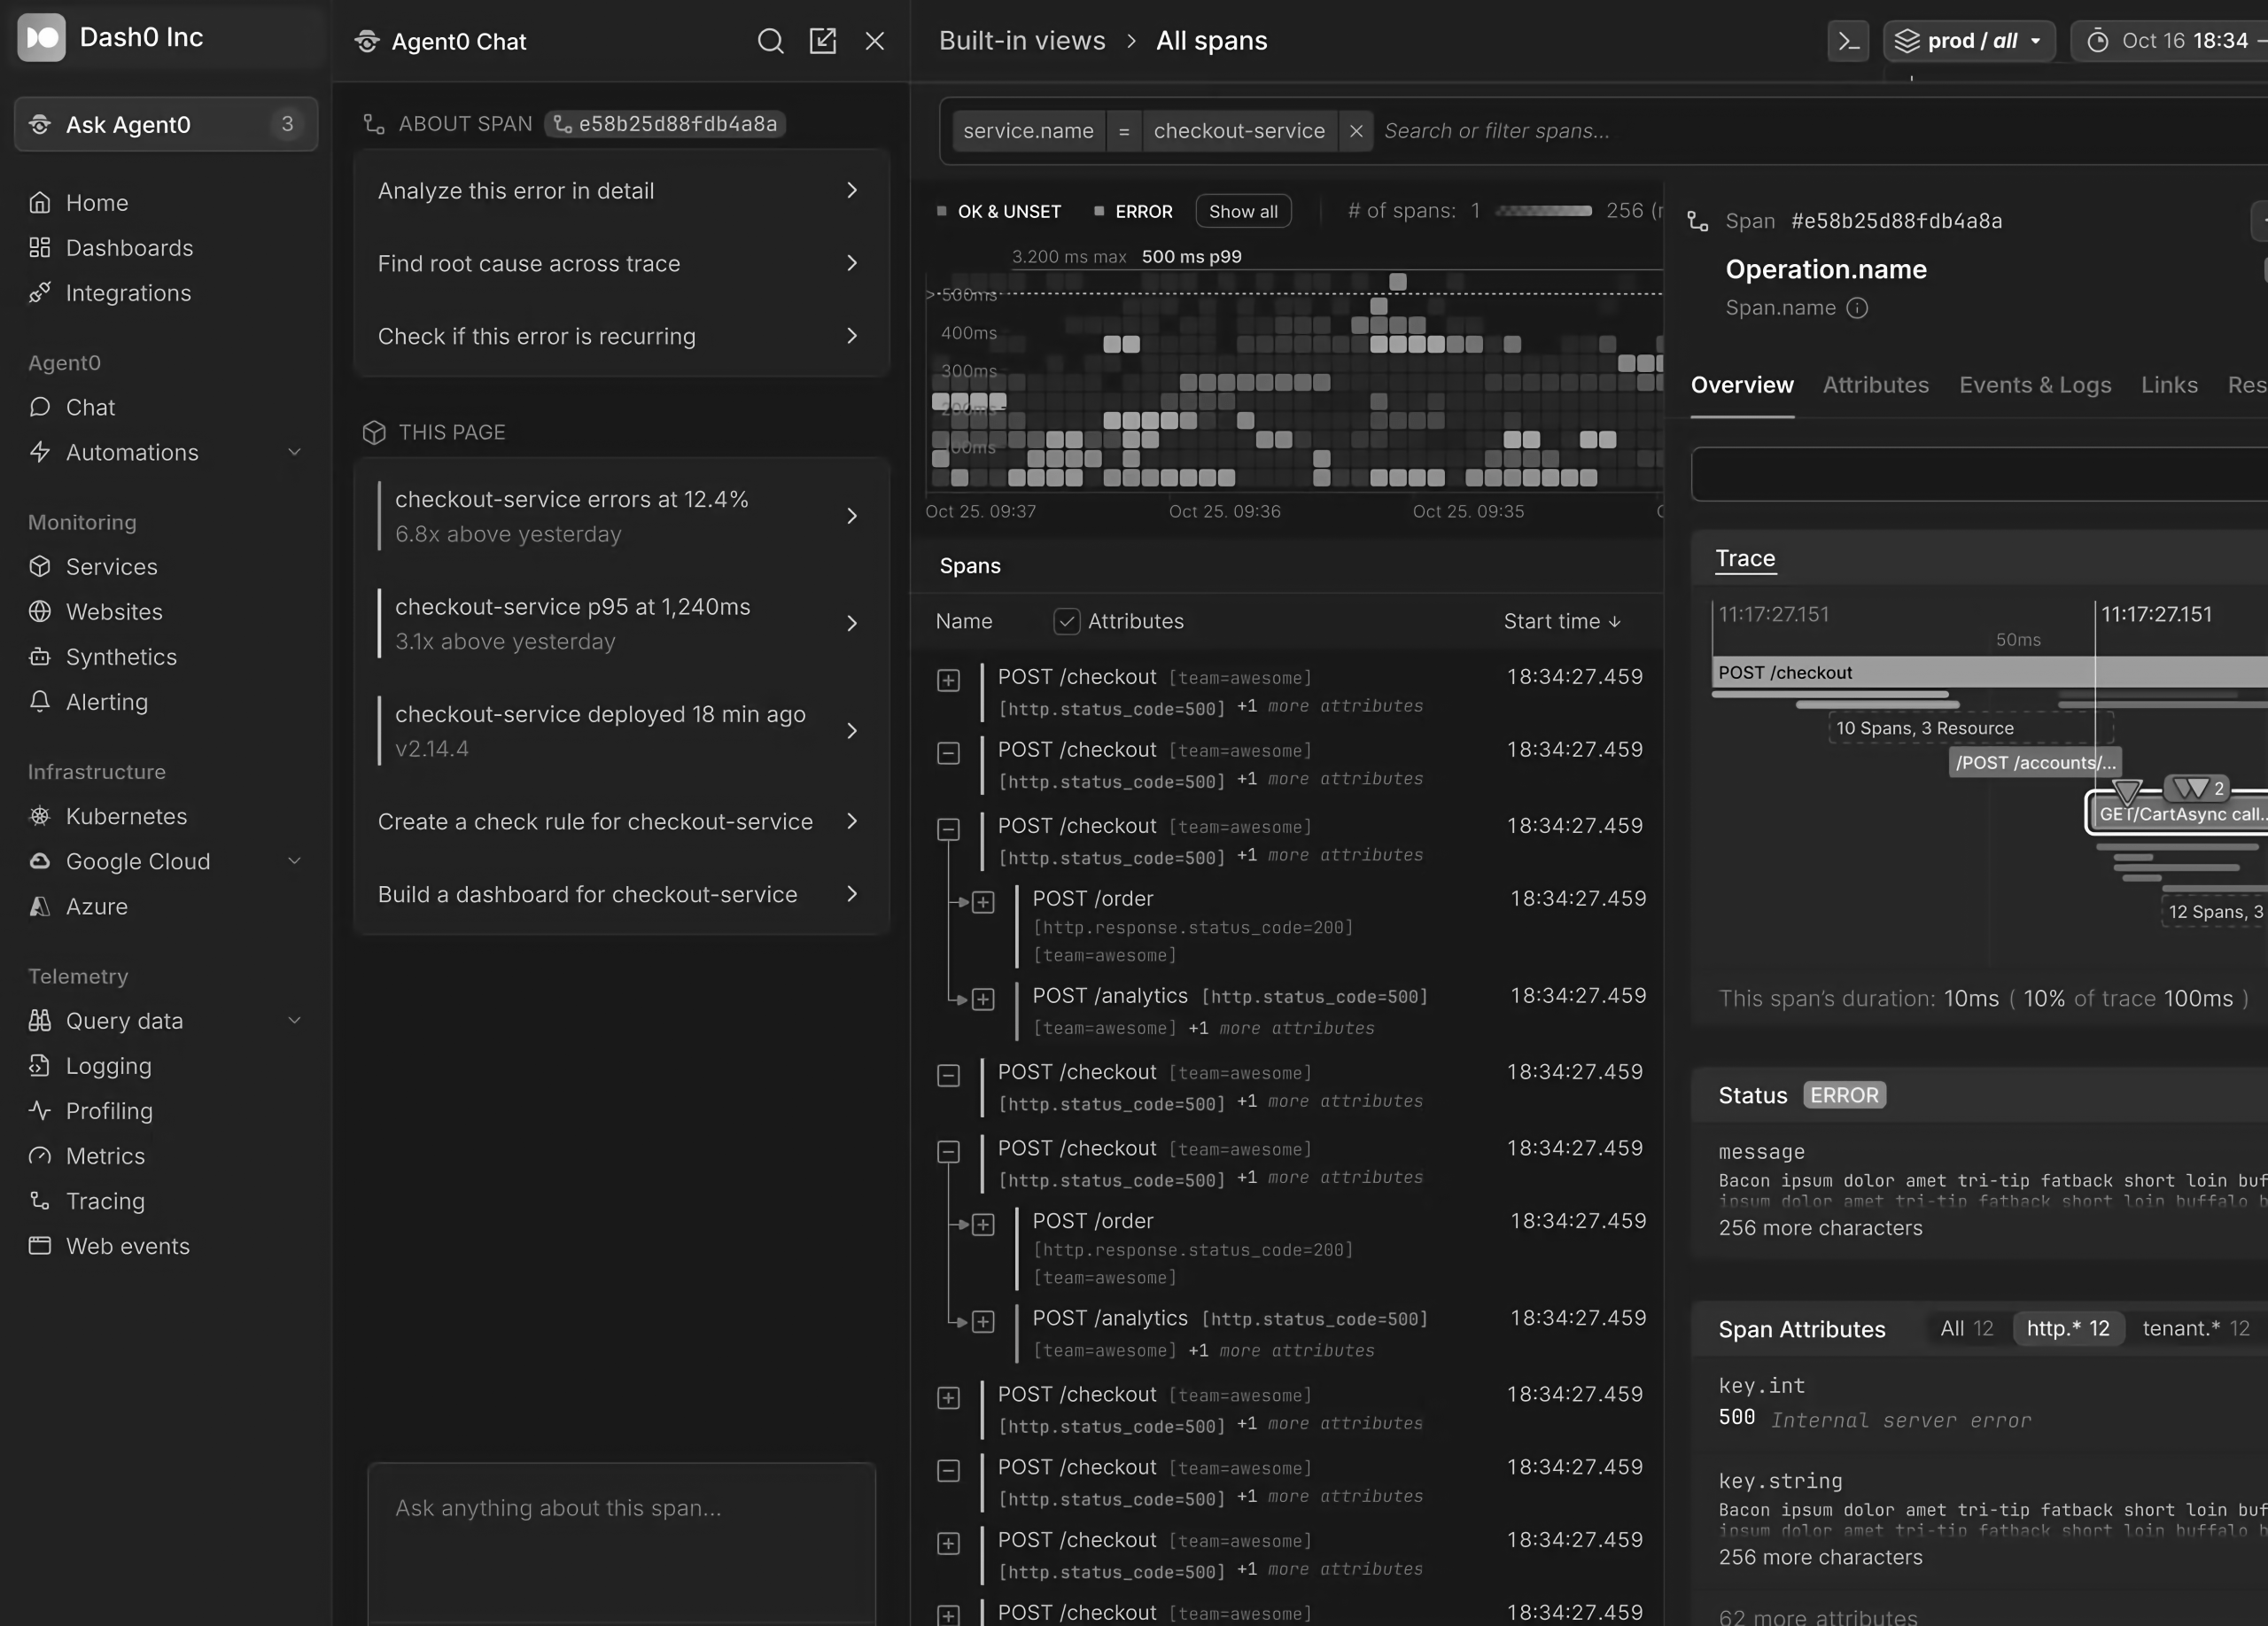
This second screen puts the assistant next to an open trace. The right rail already holds a span. The assistant offers three things: analyze this error in detail, find root cause across the trace, check whether the error is recurring. Three queries over the trace that’s already sitting on screen. Below them a section repeats the same threshold sentences . The human is staring at an error the platform already flagged red. The assistant offers to read that error back.
What This Isn’t
None of this makes the capability trivial or altogether useless, and I want to be clear about that. Automating the investigative click-path can be valuable for inexperienced engineering teams. Running queries in parallel can cut triage time. Natural-language access opens telemetry up to people who’d never write the queries by hand. Gathering the evidence saves an engineer a lot of mechanical grunt work, and a rough first draft of an incident beats a blank page.
The trouble only starts at the moment of promotion: when faster retrieval gets sold as having a system model, when a threshold crossing gets called an insight, and when query orchestration gets called situational intelligence.
The Shape Underneath
Lay the screens next to each other and one architecture shows through. They all sit at the same point on the same sequence: Something happens inside the running system. Telemetry gets emitted, shipped, indexed. A threshold fires, or a human notices. An agent runs queries over the records that are available. A narrative comes out. A human reads it.
The autonomous investigations, chat panels, and verbalized condition lists all reside at the far right end of that spectrum. Some initiate from a threshold, while others originate from a human inquiry. The elaborate version encapsulates the queries within a hypothesis tree, whereas the straightforward version presents them as simple sentences. Beneath the surface, the core process remains the same: gather evidence, categorize it, and narrate it.
What the Showcase Establishes
Situational intelligence lives inside the situation, at the moment something is happening, where signs are emitted, passed around, interpreted, and allowed to shape what happens next. A system that has it doesn’t just produce records for somebody to read later. It forms judgments as part of its own operation.
The SRE agent starts from something that’s already been marked as significant. Then it walks the representations sitting around that object (metrics, spans, logs, changes, dependencies, runbooks, catalog entries, code) and builds an evidentiary path toward a conclusion. The data can be fresh. The queries can run in parallel. The hypotheses can be generated on the fly. None of that changes where the apparatus is standing. Its territory begins and ends with records.
This is the prosthesis: a very capable reader fitted over a telemetry surface.
The agent selects, scopes, sequences, classifies, compares, and summarizes with real skill. What it doesn’t have is the thing its vocabulary keeps implying, that is a working model that lives inside the running system, sensing what matters and taking part in regulation as the situation forms.
Both vendors chose these screens. They picked the dialogue, drew the trees, composed the insight lists, and put the conclusions right where your eye would land. It shows a verbalization layer of real polish, mounted on operational data.